This site uses cookies to improve your experience. To help us insure we adhere to various privacy regulations, please select your country/region of residence. If you do not select a country, we will assume you are from the United States. Select your Cookie Settings or view our Privacy Policy and Terms of Use.
Cookie Settings
Cookies and similar technologies are used on this website for proper function of the website, for tracking performance analytics and for marketing purposes. We and some of our third-party providers may use cookie data for various purposes. Please review the cookie settings below and choose your preference.
Used for the proper function of the website
Used for monitoring website traffic and interactions
Cookie Settings
Cookies and similar technologies are used on this website for proper function of the website, for tracking performance analytics and for marketing purposes. We and some of our third-party providers may use cookie data for various purposes. Please review the cookie settings below and choose your preference.
Strictly Necessary: Used for the proper function of the website
Performance/Analytics: Used for monitoring website traffic and interactions
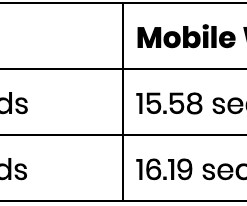
Here’s what you need to know about mobile ad viewability today. When running mobile advertising campaigns, whether in mobile apps or on mobile web, mobile ad viewability is key. desktop and mobile) environments, it’s critically important to prioritize and measure viewable ad rates. Here’s what the data reveals.
Learn How InMobi Stacks Up to the Industry When It Comes to Video Viewability for Mobile App Advertising Mobile video advertising, especially in-app, has a proven track record. It yields click-through rates that are 56% better than banners and 34% better than native ads. In Q2 2018, InMobi's total viewable rate globally was 72%.
Some food for thought from InMobi’s 2019 Mobile Programmatic Advertising Trends report : In the U.S. in Q1 2019, click-through rates (CTRs) for video ads were over 2x greater than native CTRs and over 10x greater than CTRs for banners on average. In Q1 2019, the average CTR for a video ad in the U.S.
Note: Originally published in Campaign Asia on October 8, 2019. InMobi’s 2019 Mobile Programmatic Advertising report shows a synonymous trend for global in-app spends with North America alone accounting for 59%. In looking at Q2 2019, in-app programmatic spending rose by one-third in the region compared to Q2 2018.
Luisa Zhou ) During the first half of 2022, the global viewability rate for mobile web display ads reached 66.9%, indicating that nearly 67% of display ads on the mobile web were visible during that period. Neal Schaffer ) Since 2019, the global influencer market has more than doubled. This represents a growth of 3.6 to reach $165.84
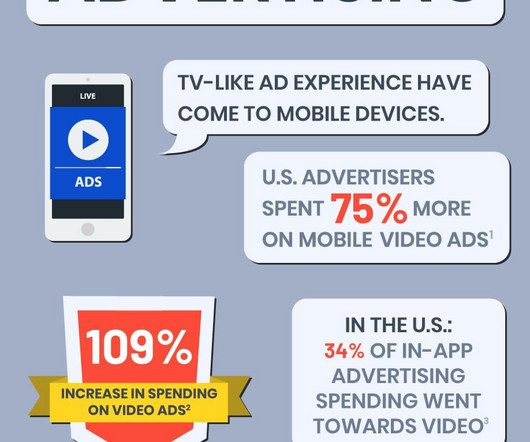
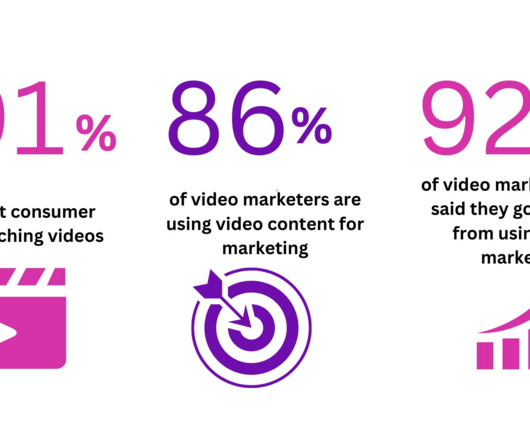
Even as the attention spans of the users of mobile devices shrink, more and more people watch video ads and respond to them at much higher rates than they do other formats like banner ads. How will the space evolve and morph in 2019 and beyond? The answer is clear: Advertisers love video ads. Publishers love video ads.
In Q4 2018 and Q1 2019, video ad spending in the U.S. After all, videos are inherently much more visible than smaller ad formats like banners, which ensures both improved viewability and engagement. that had interactive end cards went from 10% in 2018 to 60% in 2019. between 2017 and 2018.
And time spent playing mobile games is expected to rise by 17% between 2019 and 2023, eMarketer predicts. For example, InMobi’s own data has found that, compared to the average click-through rate (CTR) for banner ads, vertical videos perform 11x better. Leading the charge here is mobile gaming. smartphone owners are games.
News became the top spender Q4 2019 to Q1 2020. Programmatic Video Ideal for Brand Safety and Viewability Brands are facing the issue of brand safety with ads being placed next to inappropriate content. Another important facet of video programmatic advertising is its viewability. Shopping saw a 28% rise in spends in Q1, 2020.
By 2019, according to eMarketer. Statistics on Mobile Apps Time spent in mobile apps: two hours and three minutes for the average American, although that is expected to climb by an additional 19 minutes by 2019. Expected mobile ad spending in the future: Over $160 million worldwide in 2019, and more than $186 million in 2020.
Nonlinear video ads are ads that run concurrently with the video content, usually in the form of overlays or banners that appear on top of the video player. There are three main formats of out-stream ads: in-page, in-banner, and in-text. In-banner out-stream ads are video players within the standard display ad units.
In 2019, InMobi Exchange grew north of 25% between Q3 and Q4. the typical video click-through rates (CTRs) were 10x greater than the CTRs for banners on average and 2x greater than the average CTR for native ads. Brand spending witnessed 4x growth and UA spends grew by 7x in this period.
Video ads have a lower fill rate due to the lower demand than banner and display ads. Because video ad slots improve CTRs and conversions, the ad spend on video advertising has increased from US$36 billion to US$50 billion between 2019 and 2023. It increases viewability and, thereby, the CPMs of the video ads.
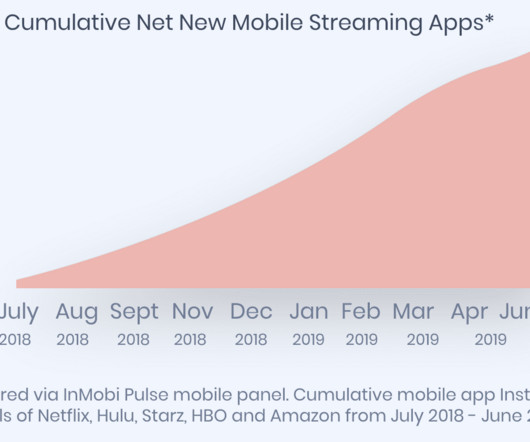
The mobile app advertising market grew by leaps and bounds in 2019. In North America, programmatic ad spend coming through InMobi Exchange during the first three months of 2019 was 299% greater than what came through during the same period in 2017. Why did mobile advertising spending grow in 2019? In the U.S.,
We organize all of the trending information in your field so you don't have to. Join 5,000+ users and stay up to date on the latest articles your peers are reading.
You know about us, now we want to get to know you!
Let's personalize your content
Let's get even more personalized
We recognize your account from another site in our network, please click 'Send Email' below to continue with verifying your account and setting a password.


Let's personalize your content